Figures 4 and 5.

Figure 5. Differential Gene Expression (DE) in LD and SD treated 100M. A. Differentially expressed genes were obtained at all timepoints using the DESeq2 package in R. Blue shading represents night. B. The number of total DE genes at each time point and intersections between time points are listed. Intersections were obtained using the UpsetR package. Peak height is proportional to number of genes at a log10 scale. SD (light + dark gray); LD (dark gray). BaseMean cutoff >= 10; FoldChange cutoff >= |2|; adj. p
Figure 6.

Figure 6. Differential Gene Expression (DE) in LD treated 100M and SM100 at each time point taken (Figure 2). Differentially expressed genes were obtained at all timepoints using the DESeq2 package in R. Blue shading represents night. BaseMean cutoff >= 10; FoldChange cutoff >= |2|; adj. p
Figure 13.

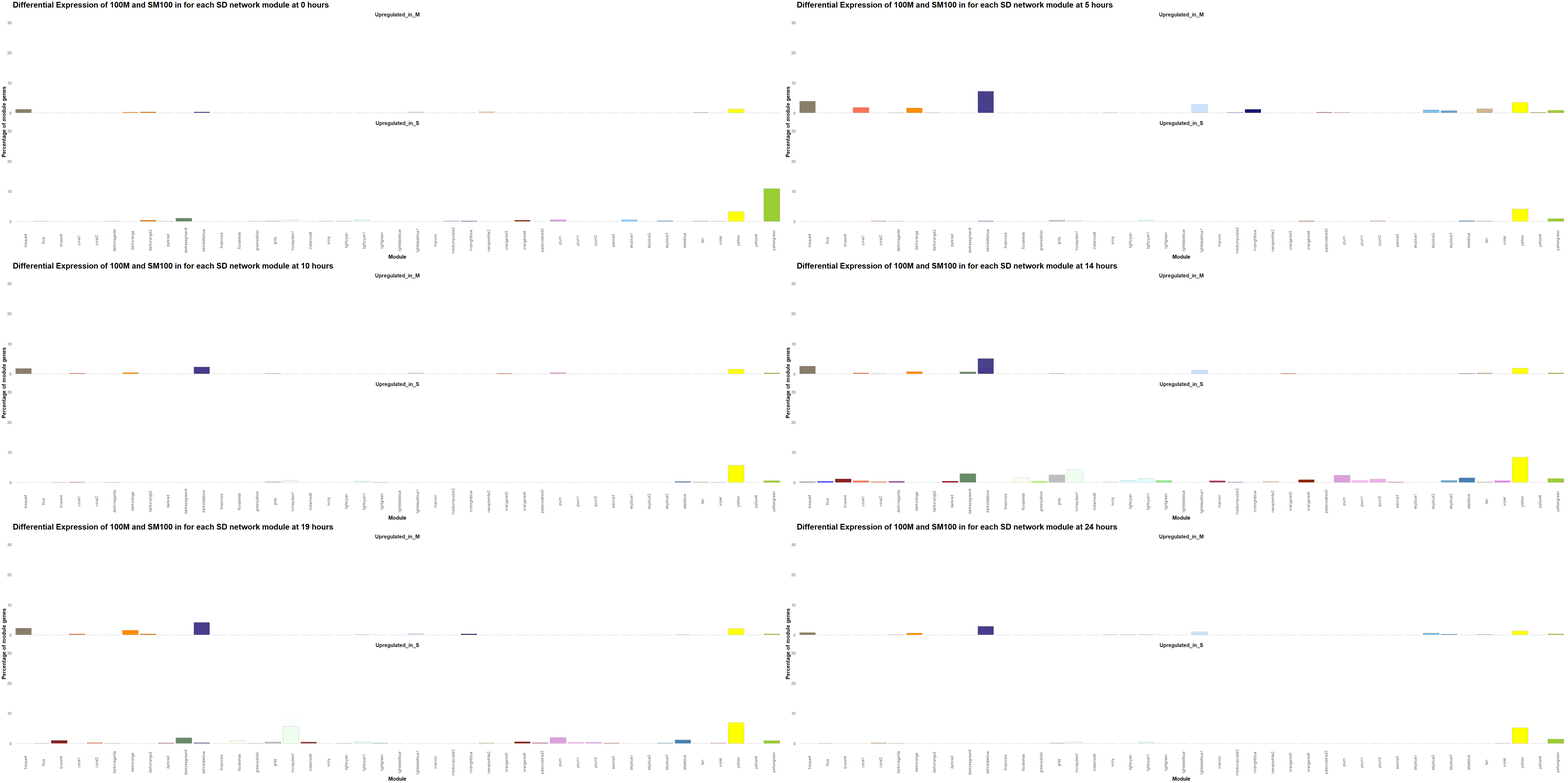
Figure 13. Percentage of genes that are upregulated in 100M or in SM100 for each module was visualized using the ggplot2 package in R for each time point. Gif created using the gganimate package in R.
Figure 14.

Figure 14. A network was generated using genes directly connected to PRR37 from the ivory (LD) module. Log2 fold change data from LD and SD treated 100M differential expression analysis was mapped to each node for each time point. Yellow is upregulated in SD, purple is upregulated in LD. Gif created using ezgif.com


